今回の目的
Hard K-means法をすらすら書けるようになって、より理解したい。
Hard K-meansとは?
教師無し機械学習法の一種です。1957年に発見されたので、ほぼ60年間も使われ続けていることになります。
入力データ
2つのGaussianの混合分布から生成します。全てのパラメータは定数とします。
実際にはRで以下のように生成します。
|
1 2 3 4 5 6 7 8 |
> x <- rnorm(100, 1, 1) > y <- rnorm(200, -1, 1.5) > x [1] 3.55440945 1.13956828 0.66996553 -1.17308267 -0.03045219 0.54874224 0.79382312 -0.54777503 -0.79043860 [10] 1.02266895 0.93474787 2.18184259 1.83739174 1.24357379 2.32703197 2.32145908 0.93608525 1.46243710 [19] 0.27974388 0.19649439 2.63546205 1.84987130 2.31033858 1.76711870 0.83373538 -0.60817340 2.38259189 > write.table(x, file="hoge.csv", sep=",", col.names=FALSE, row.names=FALSE, append=FALSE) > write.table(y, file="hoge.csv", sep=",", col.names=FALSE, row.names=FALSE, append=TRUE) |
どんな分布になったかは次のように確認します。
|
1 2 3 4 |
> data<-read.csv("hoge.csv", header=FALSE) > png("hist.png") > hist(data$V1) > dev.off() |
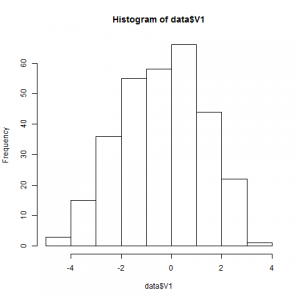
いい感じにクラスタリングしにくそう。あくまで最初のデータは、テストケースと同じ役割だと思って、コードを書き始めましょう。
何をするか
100個の点を見て、2つのクラスタに分解するプログラムを書きます。性能を目視で確認します。
コード
言語:Java
|
1 2 3 4 5 6 7 8 9 10 11 12 13 14 15 16 17 18 19 20 21 22 23 24 25 26 27 28 29 30 31 32 33 34 35 36 37 38 39 40 41 42 43 44 45 46 47 48 49 50 51 52 53 54 55 56 57 58 59 60 61 62 63 64 65 66 67 68 69 70 71 72 73 74 75 76 77 78 79 80 81 82 83 84 85 86 87 88 89 90 91 92 93 94 95 96 97 98 99 100 101 102 103 104 105 106 107 108 109 110 111 112 113 114 115 116 117 118 119 120 121 122 123 124 125 126 127 128 129 130 131 132 133 134 135 136 137 138 139 140 141 142 143 144 145 |
package dnd.main; import java.io.File; import java.io.FileNotFoundException; import java.util.ArrayList; import java.util.List; import java.util.Scanner; import dnd.model.Processor; public class Main { public static void main(String[] args) throws FileNotFoundException { List<Double> data = readCsv(); Processor proc = new Processor(data); proc.desc(); proc.iterate(true); } private static List<Double> readCsv() throws FileNotFoundException { List<Double> data = new ArrayList<Double>(); Scanner scanner = new Scanner(new File("C:\\r\\data\\hoge3.csv")); while(scanner.hasNextLine()) { if (!scanner.hasNextDouble()) break; data.add(scanner.nextDouble()); } scanner.close(); return data; } } /*----------------------------------------------------------*/ package dnd.model; import java.util.ArrayList; import java.util.List; import java.util.Random; public class Processor { private final List<Double> pts; // 各点 private final List<Integer> belong_to; // 各点がどのクラスタに属するか private final List<Double> clusters; // 平均が入る private final Random rand = new Random(System.currentTimeMillis()); private int gen = 0; // abbrev: generation private static final int MAX_GEN = 10; public Processor(List<Double> data) { this.pts = data; belong_to = new ArrayList<Integer>(); for (int i=0, l=data.size(); i<l; i++) { belong_to.add(0); } clusters = new ArrayList<Double>(2); for (int i=0; i<2; i++) { clusters.add(rand.nextDouble()); } } public void iterate(boolean verbose) { for (gen=0; gen<MAX_GEN; gen++) { update(); if (verbose) dump(); } } private void update() { // 各点がどのクラスタに属するかを計算しなおす。 // belong_toをアップデートする for (int i=0; i<pts.size(); i++) { double[] distances = distances(i); double max = 0; int max_idx = 0; for (int j=0; j<clusters.size(); j++) { if (distances[j] > max) { max = distances[j]; max_idx = j; } } belong_to.set(i, max_idx); } // クラスタの平均位置を計算しなおす。 // clustersをアップデートする for (int i=0; i<clusters.size(); i++) { // pts.stream().filter(p -> p > ) double sum = 0; double num = 0; for (int j=0; j<pts.size(); j++) { // このクラスタに属するなら平均に加算 if (belong_to.get(j) == i) { sum += pts.get(j); num++; } } if (num==0) continue; // 0このときはアップデートしない clusters.set(i, sum/num); } } private double[] distances(int i) { return clusters.stream().mapToDouble(p -> distance(p, pts.get(i))).toArray(); } /** * 1次元ユークリッド距離を採用 * @param p1 * @param p2 * @return */ private Double distance(Double p1, Double p2) { return Math.abs(p1 - p2); } public void dump() { // 標準出力にdump System.out.println("clusters state (time=" + gen + "): "); int count; for (int i=0; i<clusters.size(); i++) { count = 0; for (int j = 0; j < pts.size(); j++) { if (belong_to.get(j) == i) { count++; } } System.out.println("cluster " + i + " contains: " + count + " points. center coordinates: " + clusters.get(i)); } System.out.println(""); } public void desc() { System.out.println("-----------------------"); System.out.println("number of points: " + pts.size()); System.out.println("number of clusters: " + clusters.size()); System.out.println("-----------------------"); } } |
実行
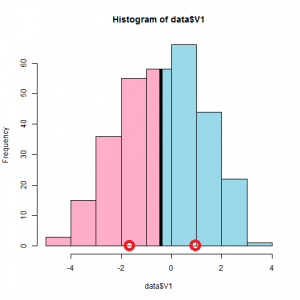
5回目のイテレーションで収束します。さすが1次元、速い。
|
1 2 3 4 5 6 7 8 9 10 11 12 13 14 15 16 17 18 19 20 21 22 23 24 25 26 27 |
----------------------- number of points: 300 number of clusters: 2 ----------------------- clusters state (time=0): cluster 0 contains: 186 points. center coordinates: -1.4129974388598074 cluster 1 contains: 114 points. center coordinates: 1.2971964866434549 clusters state (time=1): cluster 0 contains: 136 points. center coordinates: 1.1092285877425099 cluster 1 contains: 164 points. center coordinates: -1.6206842200216565 clusters state (time=2): cluster 0 contains: 154 points. center coordinates: -1.7159040371421193 cluster 1 contains: 146 points. center coordinates: 1.0226855997898359 clusters state (time=3): cluster 0 contains: 152 points. center coordinates: 0.970188295301764 cluster 1 contains: 148 points. center coordinates: -1.7730117907867464 clusters state (time=4): cluster 0 contains: 145 points. center coordinates: -1.802246176639312 cluster 1 contains: 155 points. center coordinates: 0.9444423965298704 clusters state (time=5): cluster 0 contains: 155 points. center coordinates: 0.9444423965298704 cluster 1 contains: 145 points. center coordinates: -1.802246176639312 |
元がピークが1個のデータなのでこんなもんかな?逆にリアル?
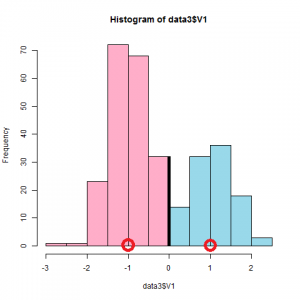
もう少し分離したデータでやると次のようになりました。
発展
次は、こんな風にしようと思います。
- 2次元でも動くプログラムを書く。
- ユークリッド距離以外も採用する。
- 多次元の斜めGaussianでも動くプログラムを書く。
- もっと面白いデータを採用する。
- Soft K-Meansにする。
まずは、2次元のデータに適用できるようにします。
入力データ
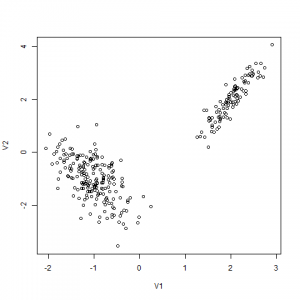
2つの2次元Gaussianの混合分布から生成します。
実際にはRで以下のように生成します。
|
1 2 3 4 5 6 7 |
> library(MASS) > x <- mvrnorm(100, mu=c(2,2), Sigma=matrix(c(0.1,0.2,0.2,0.5), 2, 2)) > y <- mvrnorm(200, mu=c(-1,-1), Sigma=matrix(c(0.2,-0.2,-0.2,0.6), 2, 2)) > write.table(x, file="hoge.csv", sep=",", col.names=FALSE, row.names=FALSE, append=FALSE) > write.table(y, file="hoge.csv", sep=",", col.names=FALSE, row.names=FALSE, append=TRUE) > z<-read.csv("hoge.csv", header=FALSE) > plot(z) |
何をするか
2次元上で、Gaussianが斜めってるときもクラスタリングできるようにします。
コードの変更点
前回まで点はDoubleで表現しましたが、今回からは次のPointクラスを作ります。
Javaで書いたときの長さ、やばいです。
|
1 2 3 4 5 6 7 8 9 10 11 12 13 14 15 16 17 18 19 20 21 22 23 24 25 26 27 28 29 30 31 32 33 34 35 36 37 38 39 40 41 42 43 44 45 46 47 48 49 50 51 52 53 54 55 56 57 58 59 60 61 62 63 64 65 66 67 68 |
package dnd.model; import java.util.ArrayList; import java.util.List; public class Point { private List<Double> coord = new ArrayList<Double>(); public int append(double newCoord) { coord.add(newCoord); return coord.size(); } public int size() { return coord.size(); } public void add(Point point) { if (size() < point.size()) { fillZero(point.size()); } for (int i=0, l=coord.size(); i<l; i++) { coord.set(i, coord.get(i) + point.get(i)); } } private void fillZero(int size) { for (int i=size(),l=size; i<l; i++) { coord.add(0.0); } } public double get(int index) { return coord.get(index); } public Point divideBy(double num) { for (int i=0, l=coord.size(); i<l; i++) { coord.set(i, coord.get(i)/num); } return this; } /** * n次元ユークリッド距離を採用 * @param p * @param point * @return */ public Double distance(Point point) { double s = 0; for (int i=0, l=coord.size(); i<l; i++) { s += Math.pow(coord.get(i) - point.get(i), 2); } return Math.sqrt(s); } public String toString() { StringBuilder b = new StringBuilder(); b.append("["); for (int i=0, l=coord.size(); i<l; i++) { b.append(coord.get(i)); if (i!=l-1) b.append(","); } b.append("]"); return b.toString(); } } |
やりたかったのは、ベクトル演算だけです。
あとは、コードのほかの部分をPointクラス対応させました。Java以外では生じない作業ですが、Javaは書きやすくて速くてライブラリが充実してるので仕方ないと思っています。
実行
2次元でも特に問題なく4~5回で収束します。(データのせいだとは思います)
|
1 2 3 4 5 6 7 8 9 10 11 12 13 14 15 |
----------------------- number of points: 300 number of clusters: 2 ----------------------- clusters state (time=0): cluster 0 contains: 152 points. center coordinates: [0.8243998874596067,1.2864114984381305] cluster 1 contains: 148 points. center coordinates: [-0.8811133753258286,-1.345865595513471] clusters state (time=1): cluster 0 contains: 198 points. center coordinates: [-1.0303177452999635,-1.041566356990283] cluster 1 contains: 102 points. center coordinates: [1.9500678128924533,1.9860448853988062] clusters state (time=2): cluster 0 contains: 100 points. center coordinates: [2.0120811368147398,2.0054231647075054] cluster 1 contains: 200 points. center coordinates: [-1.0315205516791826,-1.0209793842207417] |
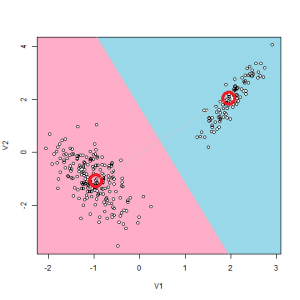
クラスタリング出来ました。感動ですね!!
ピンバック: 実践:Hard K-means法 | The Big Computing
ピンバック: データサイエンス人気記事 - The Big Computing