今回の目的
前回作ったデータでは、Soft K-means法のほうがHard K-means法よりも劣った性能を出してしまったが、それは理論の予測どおりだった。
MacKay Information Theory, Inference and Learning Algorithmsの問題20.4への解答を通じて、Soft K-means法のほうが性能が向上する場合があることを確かめる。
入力データ
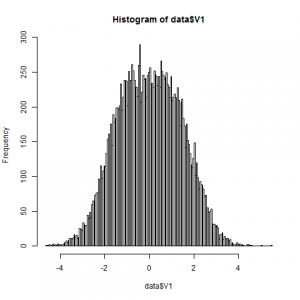
2つの1次元Gaussianの混合分布から生成します。ただし、今回はかなり中心を近くとります。
問題20.4の条件と同様に、
- 分布1: 平均1, 分散1
- 分布2: 平均-1, 分散1
となるようにとります。このデータの特徴は次の2点です。
- 2つのクラスタというより、1つのクラスタに見える
- 平均値に対する、テールのデータの寄与が大きい
何をするか
上記データを、Soft K-means(β=1)、Soft K-means(β=100)、Soft K-means(β=10000)、Hard K-meansでクラスタリングし、平均の位置を比較します。
実行
Soft K-means(β=1):
|
1 2 3 |
clusters state (time=0): cluster 0's total weight is 9644.791519796787. center coordinates are [0.23440146270213622] cluster 1's total weight is 10355.208480203213. center coordinates are [-0.2188427525588068] |
結果:
-0.22,0.23
Soft K-means(β=100):
|
1 2 3 |
clusters state (time=0): cluster 0's total weight is 6041.354475187794. center coordinates are [1.6644729239531832] cluster 1's total weight is 13958.645524812206. center coordinates are [-0.7207776726972892] |
結果:
-0.72,1.66
Soft K-means(β=10000):
ここで問題勃発しました。
指数による減衰が強すぎて、0での除算が出てしまいます・・・。
stackoverflowの皆様のおかげで、精度無限大の指数関数を組んでいる研究者のかたが見つかったので、コードをお借りしました。
デバッガで除いたら、10のマイナス6000乗とかまで指数減衰していました。
ちなみに、ライブラリの中は覗きましたが何をしているかさっぱりでした。
stackoverflow:
http://stackoverflow.com/questions/16441769/javas-bigdecimal-powerbigdecimal-exponent-is-there-a-java-library-that-does
BigDecimalMath:
http://arxiv.org/src/0908.3030v2/anc
結果:
めちゃくちゃ遅いけどどうにか計算できました。
|
1 2 3 |
clusters state (time=0): cluster 0's total weight is 7274.988473797426. center coordinates are [1.4992396336703036] cluster 1's total weight is 12725.011526202574. center coordinates are [-0.8575520831058994] |
-0.86,1.50
Hard K-means:
注目のHard K-meansです。
|
1 2 3 4 5 6 7 8 9 10 11 12 13 14 15 16 17 18 19 20 21 22 23 24 25 26 27 28 29 30 31 32 33 34 35 36 37 38 39 40 41 42 43 44 45 |
----------------------- number of points: 20000 number of clusters: 2 ----------------------- clusters state (time=0): cluster 0 contains: 12335 points. center coordinates: -0.9012775396668274 cluster 1 contains: 7665 points. center coordinates: 1.4496868055264802 clusters state (time=1): cluster 0 contains: 8680 points. center coordinates: 1.3246057343821882 cluster 1 contains: 11320 points. center coordinates: -1.0161649171260791 clusters state (time=2): cluster 0 contains: 10750 points. center coordinates: -1.0814930869227788 cluster 1 contains: 9250 points. center coordinates: 1.256285578052979 clusters state (time=3): cluster 0 contains: 9566 points. center coordinates: 1.2188588836042236 cluster 1 contains: 10434 points. center coordinates: -1.1179809438362862 clusters state (time=4): cluster 0 contains: 10272 points. center coordinates: -1.1366905550441102 cluster 1 contains: 9728 points. center coordinates: 1.199699454562428 clusters state (time=5): cluster 0 contains: 9829 points. center coordinates: 1.1877937564145173 cluster 1 contains: 10171 points. center coordinates: -1.1483859914686947 clusters state (time=6): cluster 0 contains: 10110 points. center coordinates: -1.1554701130195535 cluster 1 contains: 9890 points. center coordinates: 1.180626264428502 clusters state (time=7): cluster 0 contains: 9929 points. center coordinates: 1.1760514923216288 cluster 1 contains: 10071 points. center coordinates: -1.1600063900994195 clusters state (time=8): cluster 0 contains: 10056 points. center coordinates: -1.1617518275735528 cluster 1 contains: 9944 points. center coordinates: 1.1742927685689706 ... (中略) ... clusters state (time=99): cluster 0 contains: 9959 points. center coordinates: 1.1725333791080768 cluster 1 contains: 10041 points. center coordinates: -1.1634965650798863 |
結果:
-1.16, 1.17
何と、Hard K-meansのほうが性能が良い(真の値に近い)と言う結果に!教科書と違う!
特に、βがかなり大きくても、Soft K-meansはHard K-meansの結果と実際には一致しません。
無限と現実は違うのかもしれません。これは収穫でした。
(もちろん実装が間違っている可能性もあります。)
発展
MacKayに書かれている答えは、
- Hard K-meansはテールのデータの影響を受けて、平均は(-1,1)より外側に落ちる
- しかも、-1,1より大きく外側に落ちる
- Soft K-meansはβが大きすぎると2つの固定点が、1つの固定点0に縮退する
の3点で、1番目しか成り立っていないようにも思えます。引き続き追求したいところです。

ピンバック: 実践:Soft K-means法 | The Big Computing